地球风场
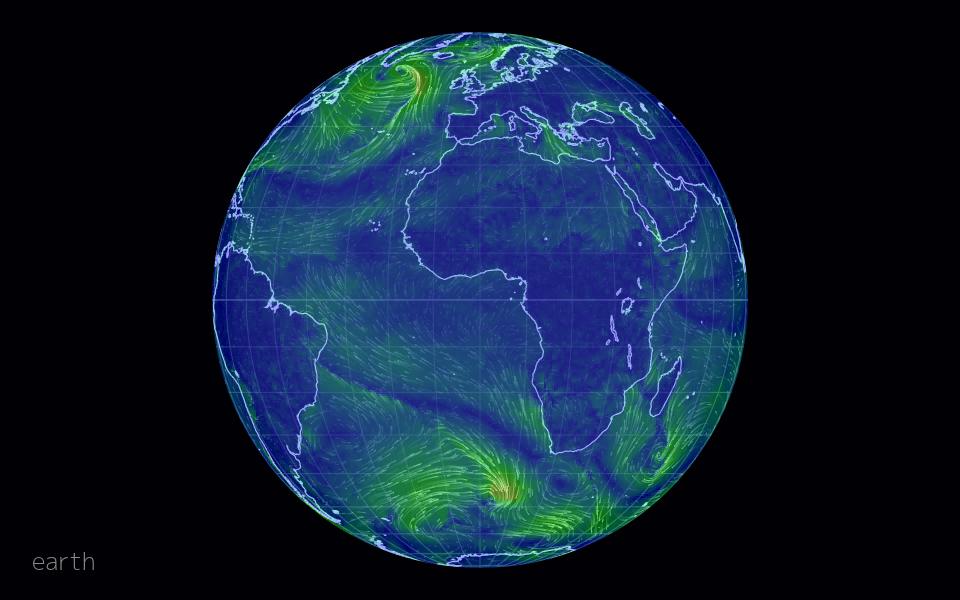
earth,Cameron Beccario,2013 年
正在布展…
它是怎么做的
- 第 1 步气象数据(GFS 模型的 GRIB2)被预处理成按经纬度网格存储的 u/v 风速 JSON
- 第 2 步D3 地理投影把球面坐标映射到屏幕,并支持多种投影切换
- 第 3 步在屏幕上随机撒下粒子,每帧对风场做双线性插值并沿风向移动粒子
- 第 4 步画布每帧用半透明填充“擦除”上一帧,留下渐隐的轨迹
- 第 5 步拖拽改变投影旋转,重新计算可见区域的插值场
复刻配方
一段技术配方,可以直接交给 AI 编程助手,也可以自己照着写。想指定技术栈、位置和性能预算,就把它加入实现方案。
Preprocess a global wind dataset into a regular latitude-longitude grid of u and v components. Use a D3 orthographic projection to draw land outlines, and build a screen-space vector field by inverse-projecting each pixel block and bilinearly interpolating the grid, accounting for projection distortion. Seed a few thousand particles at random visible points, move them along the interpolated vector each frame, give them a random max age, and respawn them when they expire. Fade the canvas each frame with a translucent fill so particles leave trails, and colour them by wind speed.
档案
性能开销
视觉强度
实现难度
尺度为策展判断(1 到 5),用于比较和推荐。
核实记录:Opened https://earth.nullschool.net (200, title 'earth :: a global map of wind, weather, and ocean conditions'); repo cambecc/earth exists, licence MIT via GitHub API. Note the live site is a newer closed-source version; the repo holds the original 2013–2015 code.